44. Text: Table Calculations
Text for Previous Video on Table Calculations
Table Calculations
Table calculations can be really useful for helping you to compare the data that exists in a plot to other parts of the plot. This is easier to understand by just doing it - so let's look at an example.
Let's compare the amount of profit from one market to the next.
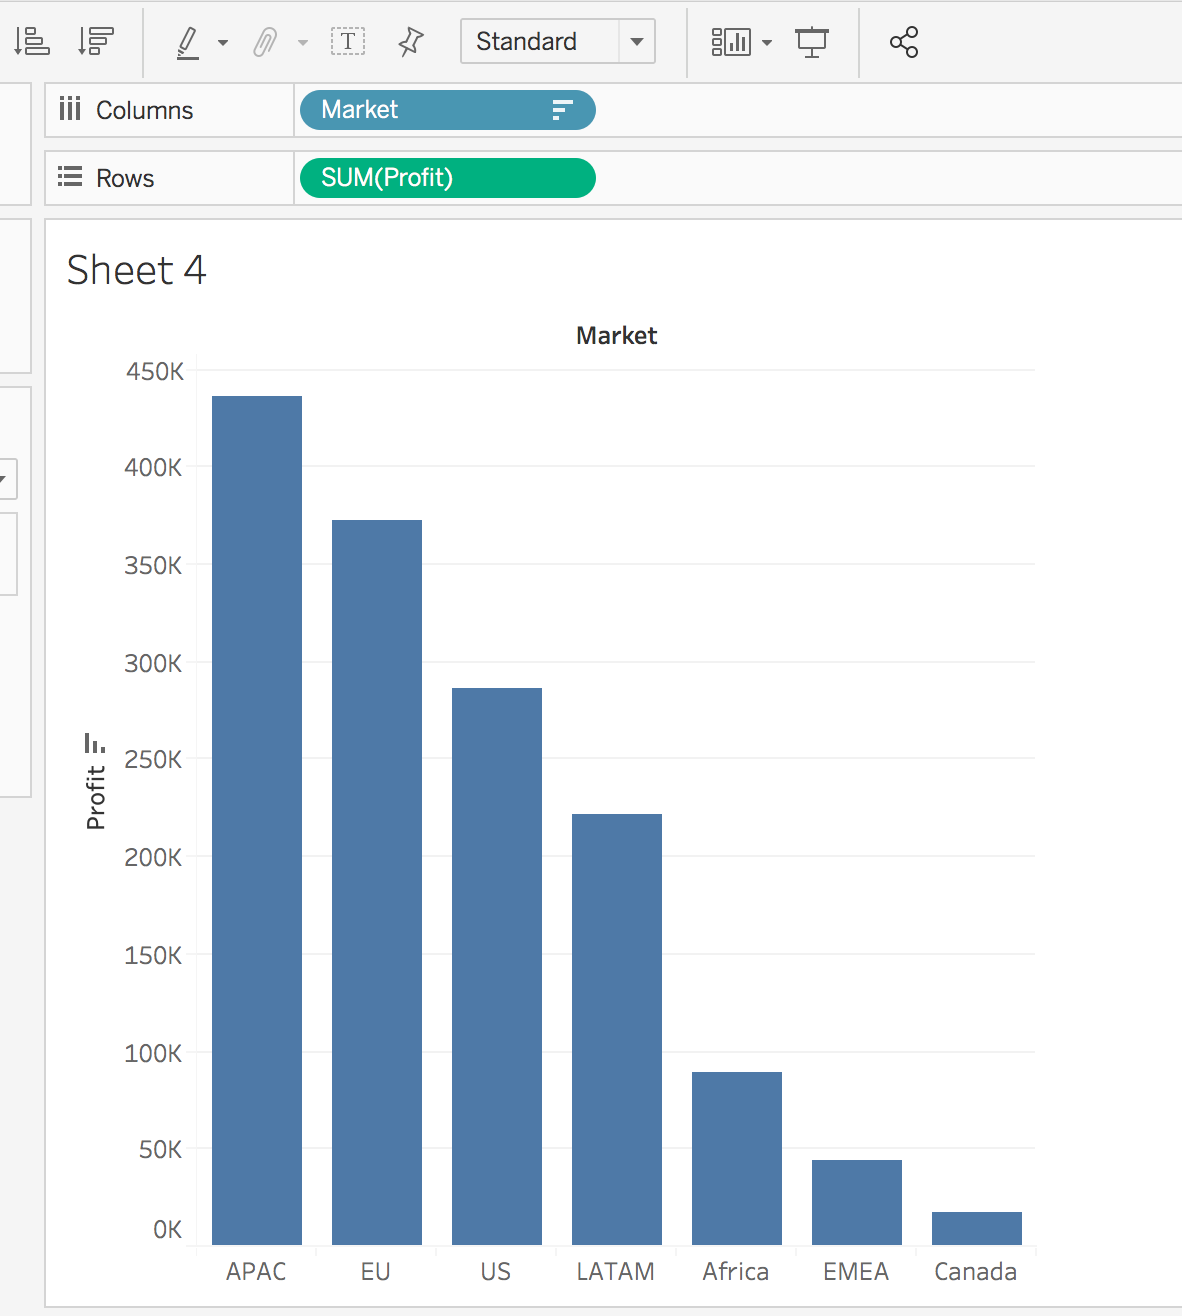
Great, but what if we want to compare the percent of profits from each market to the total profit.
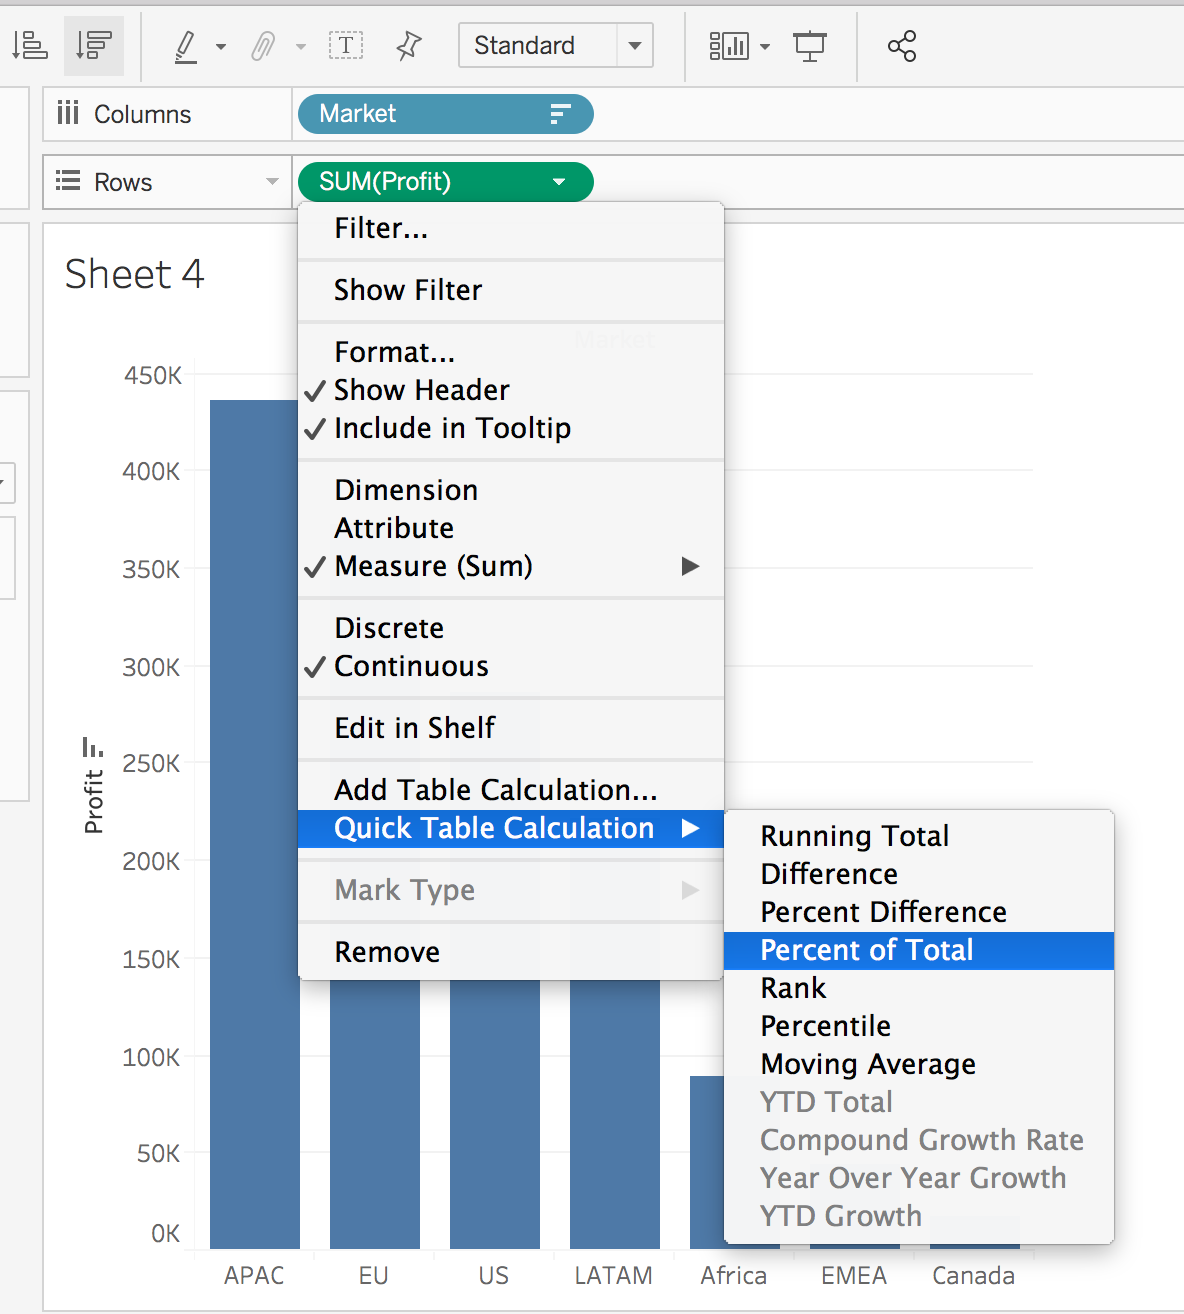
This can be done by doing a Table Calculation. Select the drop down associated with SUM(Profit), and select Quick Table Calculation... > Percent of Total. Alternatively, it could be useful to look at compounding profit, which is also easily done from the same menu.
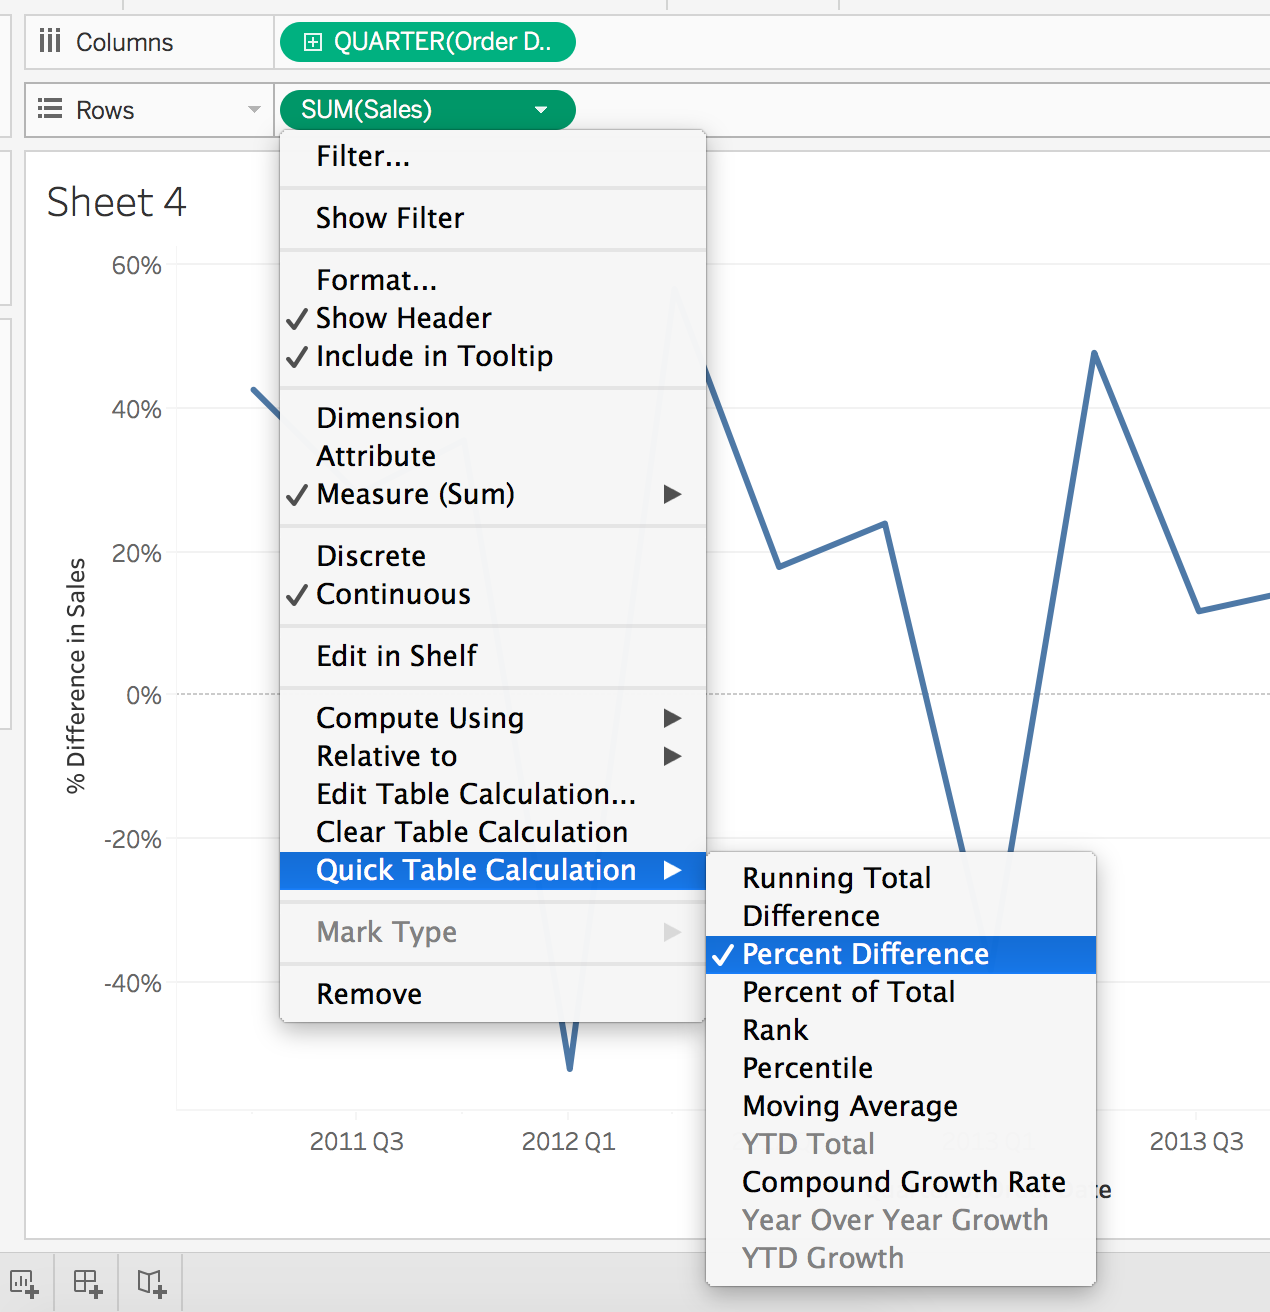
A lot of table calculations work well for line plots. Let's take a look at an example. Add the Order Date to the Columns and Sales to the Rows. Make sure the Order Date is continuous. Drill down to the Quarter level, and select Quick Table Calculation... > Percent Difference.
In order to get a better idea of how things are moving over time, we might use a moving average. You can see below how this is done using the table calculations. Additionally, I broke out the Category to see how things change over time for each.
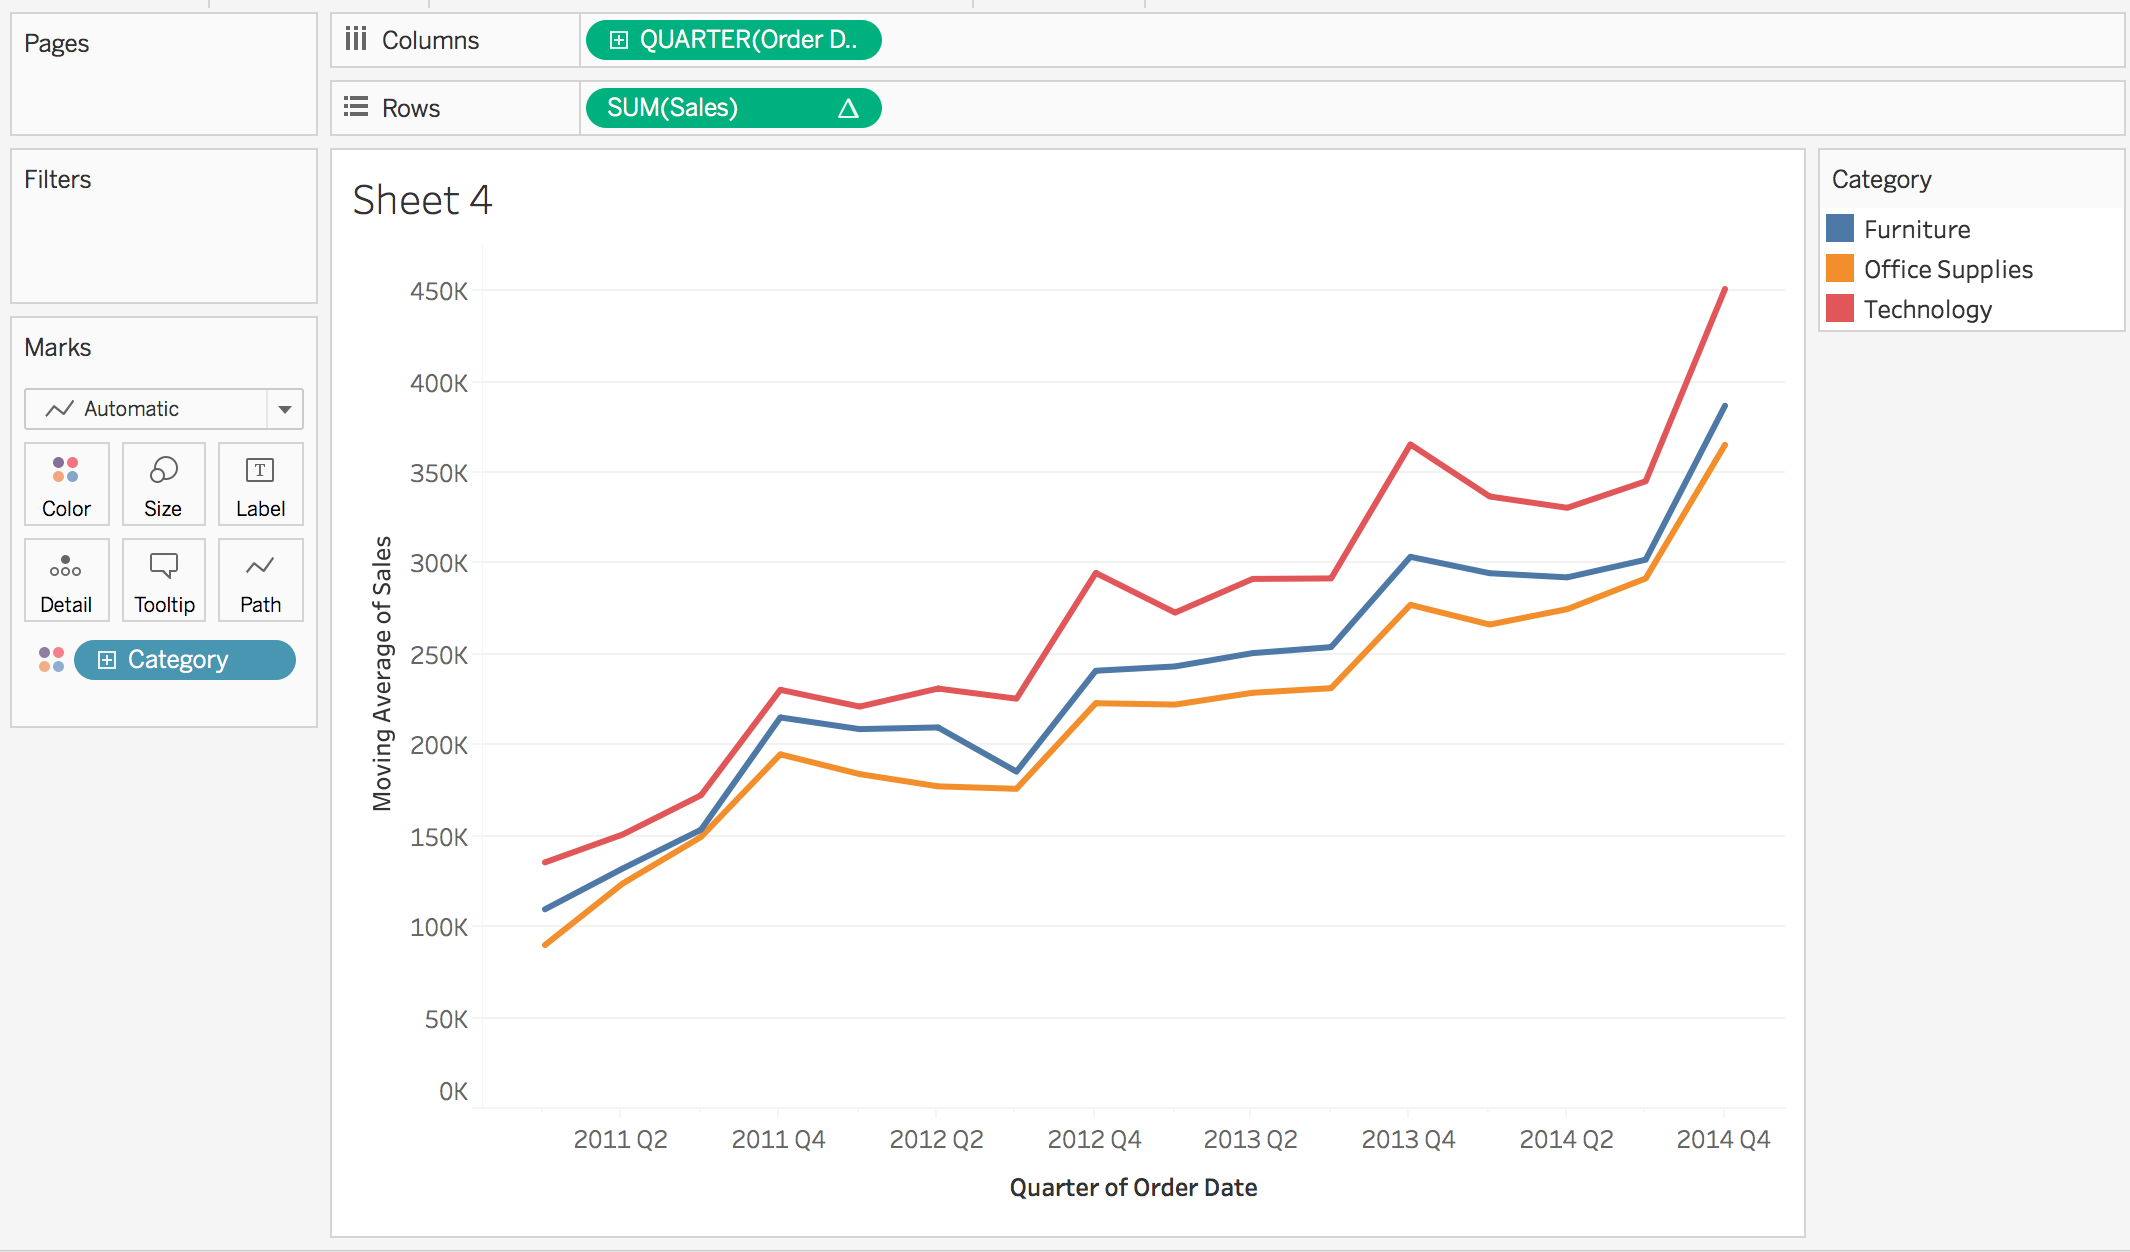
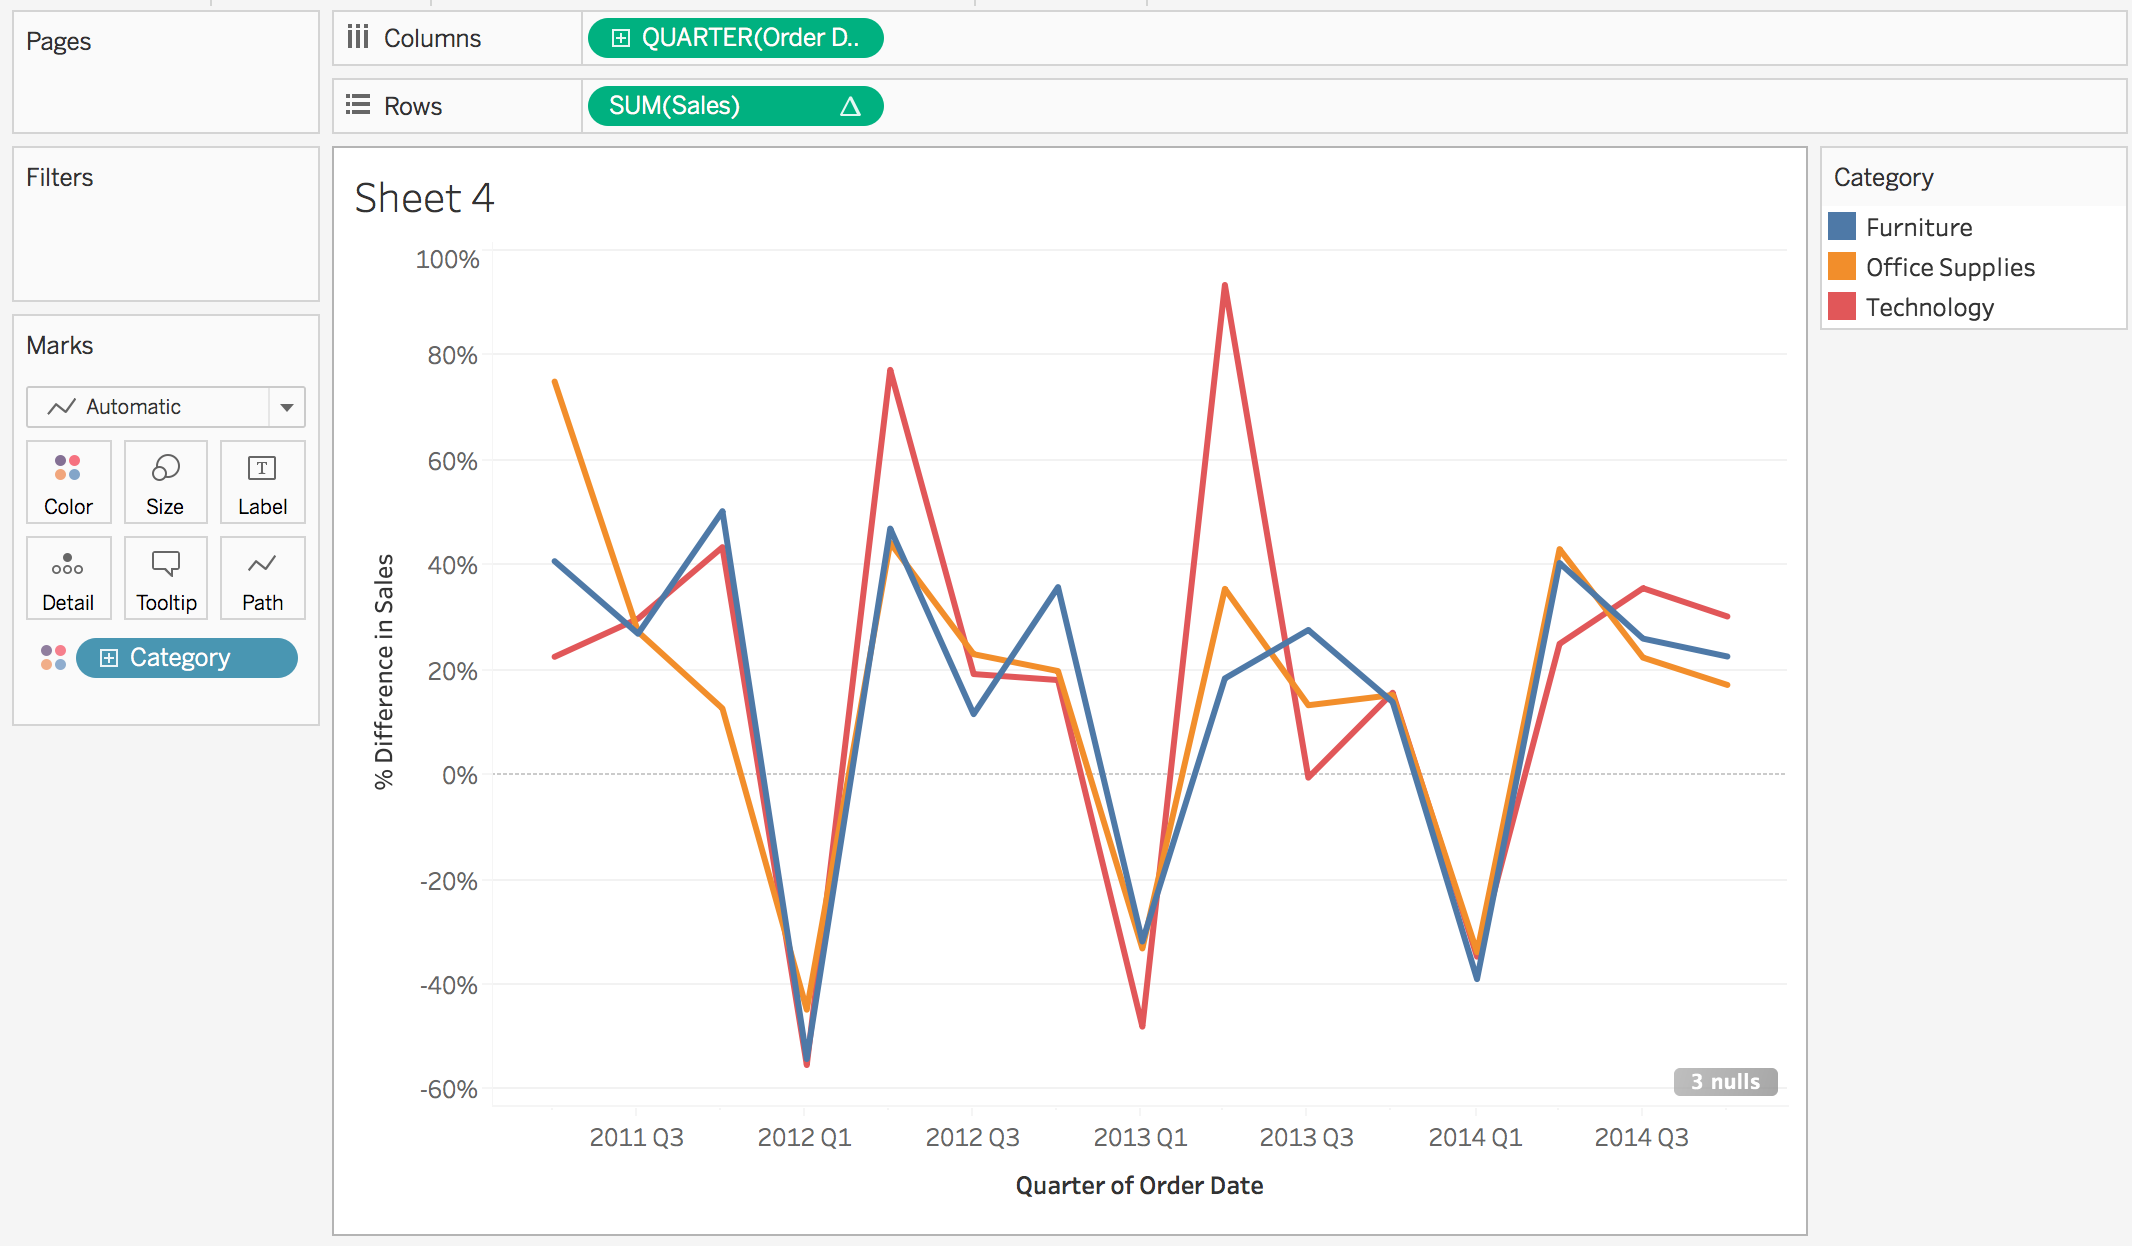
This plot is great for seeing the trend of the data, and that sales are increasing, but they aren't great for seeing how sales are changing over time from one quarter to the next. Instead, the last question on the next concept requires the plot below.
